Faced with the challenging task of managing and interpreting a wealth of student data generated daily, how do school administrators find their path to effective data utilization? This is where data dashboards come into play, offering a transformative approach to data management in K-12 education.
What is a Data Dashboard?
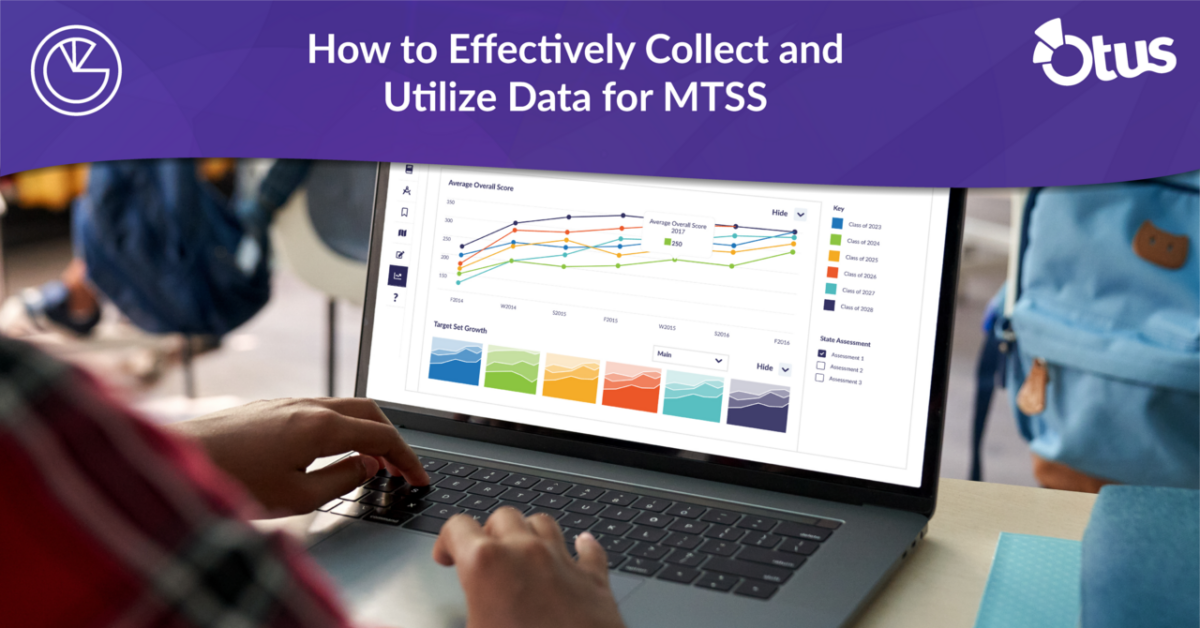
A data dashboard in education is a dynamic, visual representation of a school’s key metrics and performance indicators. For instance, a dashboard might display real-time attendance figures, enabling administrators to quickly spot trends, such as a dip in attendance on certain days, prompting timely interventions.
How do Data Dashboards Work in an Educational Context?
In K-12 settings, data dashboards collate information from varied sources like student information systems and assessment tools. For example, a dashboard might integrate data from standardized tests and classroom assessments to give a comprehensive view of student academic progress, aiding in curriculum adjustments and resource allocation.
What Types of Data are Typically Included in a School Data Dashboard?
The diversity of data available to school administrators through a data dashboard is vast and varied, offering a comprehensive view of the educational ecosystem. These dashboards usually include several key categories of information, each providing critical insights for informed decision-making and effective school management.
School data dashboards typically include:
- Student Academic Data: Attendance, grades, and test scores. For example, by tracking attendance and correlating it with academic performance, administrators can identify and support individual at-risk students and student groups.
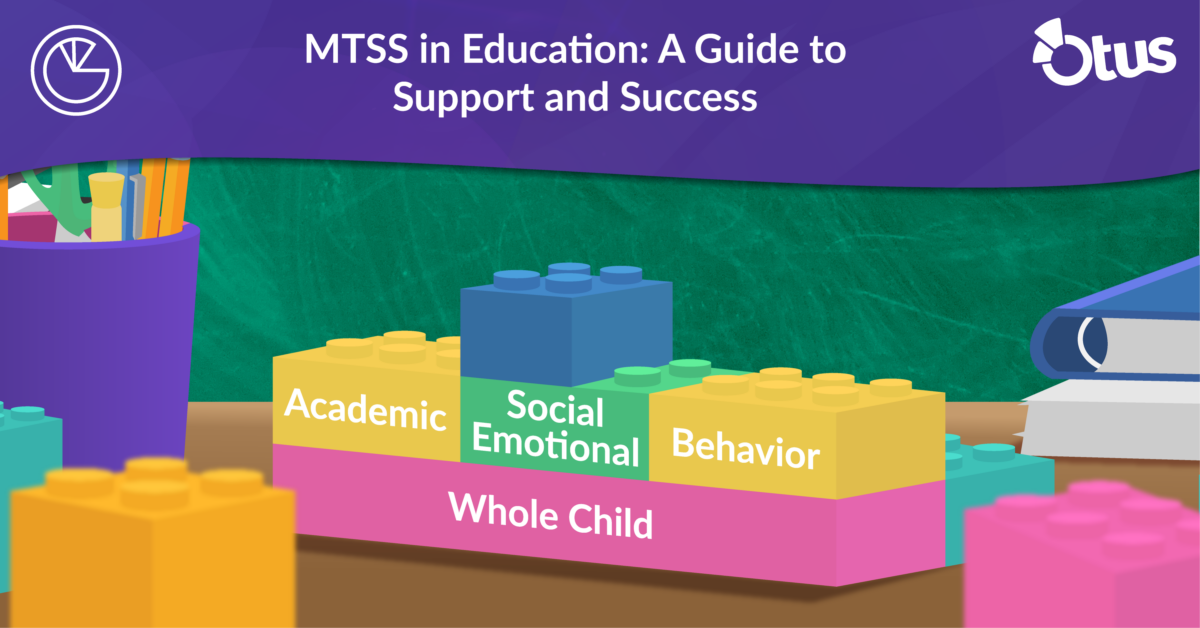
- Social-Emotional Learning (SEL) and Executive Functioning Data: Dashboards that include data on SEL and executive functioning provide a comprehensive view of students’ emotional, social, and cognitive development. This encompasses not only their emotional well-being but also key skills like organization, time management, and emotional regulation. Such insights are invaluable for designing targeted interventions and support programs, ensuring a well-rounded approach to student growth.
- Teacher Metrics: Performance evaluations can be used to identify professional development needs, as seen in some districts where dashboard insights have guided tailored teacher training programs.
Current Challenges School Administrators Face
In the demanding role of school administration, leaders encounter a unique set of challenges that can impact the efficiency and effectiveness of their schools. These challenges often revolve around the handling and interpretation of data, which is crucial for making informed decisions. Administrators commonly face issues like data fragmentation and cumbersome reporting processes, which can hinder their ability to effectively manage their schools. Traditional systems, while functional, may not provide a quick and comprehensive way to identify and respond to trends affecting student performance. For example, without a dashboard, administrators might find it difficult to compile and analyze disparate data sources for insights into student well-being or academic progress, illustrating the need for more integrated and efficient data management solutions.
Benefits of Data Dashboards for School Administrators
The implementation of data dashboards in school administration brings with it a plethora of benefits that transform the way school leaders approach their daily tasks and long-term planning. These tools not only enhance the efficiency of administrative operations but also play a pivotal role in shaping strategies that directly impact student success. From facilitating more informed decision-making to streamlining complex operational tasks, the advantages of data dashboards extend across various aspects of school management, including:
- Improved Decision-Making: Dashboards provide real-time data, like sudden changes in student performance or attendance, allowing for prompt, informed decisions.
- Streamlining Operations: Automating tasks such as reporting and data analysis saves time. For example, a school might use a dashboard to automate state reporting, thereby reducing the need for manual work and streamlining operational efficiency.
- Enhancing Student Outcomes: Dashboards can highlight areas where students struggle, allowing for targeted interventions. For instance, a school could leverage dashboard insights to overhaul a reading program, potentially leading to improved literacy rates among students.
- Tailoring to Administrator Needs: Unlike tools designed for teachers, an administrator’s dashboard offers a broader view, crucial for strategic planning. For instance, a dashboard could reveal enrollment trends over years, aiding in long-term resource planning.
Data in Action
For K-12 administrators, effectively using data involves combining technology and strategy, with data dashboards playing a key role in shaping educational outcomes. Two administrators illustrating this approach are Kristen Schmitz, Director of School Improvement for Norwalk Public Schools, and Paul O’Malley, Superintendent for Butler School District 53, who demonstrate the effective and transformative use of data dashboards in their leadership.
Norwalk’s current use of student data tools stands as a testament to effective and impactful educational strategies. However, the journey to this point involved overcoming some significant challenges. “While there was an expectation that schools were analyzing data and teachers were adjusting instruction based on that data, it was very cumbersome – nothing was standardized,” said Schmitz. “We realized that as we were asking schools to do this work, we hadn’t provided a tool for them to be able to more effectively engage in the work.”
The introduction of Otus, an all-in-one student data platform, has streamlined Norwalk’s process, enabling its educators to access and analyze a variety of data points efficiently. This holistic approach not only covers academic performance but also includes social-emotional learning and attendance, offering a complete view of student development.
“Implementing Otus has also allowed our teachers access to everything from data about our multilingual learners to how they’re performing on state tests. All of that being available in one place alongside attendance and grades has been a huge leap forward.”
In equipping its educators with the proper data tools, Norwalk has ensured that educational decisions are well-informed and contribute to creating an equitable and effective learning environment.
At Butler, the introduction of a data dashboard under Superintendent Paul O’Malley’s guidance has been a transformative step in reshaping their educational approach. This shift has enabled the district to centralize and effectively utilize student data, enhancing the way they track and support student progress.
“One of the things we really do well is set performance goals for each and every one of our students, and also create personalized learning plans,” said O’Malley. “We use our common assessments in the classroom to triangulate the data so that we can really centralize a dashboard to view all data points and then identify common themes for students who are struggling according to our MTSS model.”
The implementation of the Otus platform has been a key factor in Butler’s strategic shift, significantly improving the district’s capacity to manage and interpret educational data. Alongside academic metrics, Butler also prioritizes social-emotional learning, striving for a balanced and comprehensive educational experience. The effective use of a data dashboard has empowered educators to interpret and apply data from various sources, enabling them to develop educational strategies that address both the academic and social-emotional needs of students.
Easily Integrate with Your Current System
Otus excels in data integrations, offering a unified platform that simplifies and consolidates the management of all student data. Otus effectively integrates various data sources to enhance educational decision-making through:
- Centralized Data Management: Otus houses all existing student data points in one place, allowing educators to make informed decisions using comprehensive data.
- Integration with Third-Party Assessments: Otus automatically receives data from key assessment programs like NWEA, Renaissance, and iReady as students participate in testing.
- Support from the Otus Client Data Team: A dedicated team assists in uploading and organizing all student data within the platform. This includes a wide range of nationally-represented assessments such as ACT, SAT, DIBELS, and many more.
- Extensive Range of Supported Assessments: Otus supports a growing list of state-specific assessments, including ACT/PreACT, SAT, NAEP, and various state-specific tests like CAASPP, ILEARN, and MCAS.
- Local Student Data Integration: Beyond standardized tests, Otus also integrates local student data from local assessments, attendance records, behavior reports, GPA, and transcripts.
- Holistic View of Student Progress: By integrating these diverse data sources, Otus provides educators with a holistic view of each student’s progress, encompassing academic, social-emotional, and behavioral aspects.
Otus’ robust integration capabilities ensure that educators have a comprehensive, accessible, and up-to-date view of student performance, enabling them to tailor their teaching strategies effectively and make data-informed decisions.
Above and Beyond Your Traditional Data Warehouse
Busy school administrators need answers – and they need them quickly when it comes to student data. In response to the need for real-time insights about student growth, Otus released an activity dashboard.

- Frequency of logins by administrators, teachers, and families.
- Otus usage trends by school building and over time.
- Number and types of assessments assigned and graded by teachers.
- Most frequently assessed standards and consistency in measuring student performance on these standards.
- Utilization and update frequency of progress monitoring plans.
- Number of students entering and exiting progress monitoring plans.
- Number and recency of updates in 3rd party data sets.

To see the Otus activity dashboard in action, get in touch with an Otus expert.