Jun 23, 2026
Data-Driven Success: Insights from Kristin Schmitz, Director of School Improvement at Norwalk Public Schools
A Conversation with Kristin Schmitz
As educators navigate the challenges and opportunities of the K-12 landscape, it's essential to spotlight the voices of those at the forefront of change. We recently sat down with Kristin Schmitz, the director of school improvement for Norwalk Public Schools in Connecticut. In a district that supports 11,000 students, Kristin's role is pivotal in ensuring that their schools harness data effectively to drive student success. Throughout our conversation, Kristin delved into the district's journey over the past year and a half, highlighting their commitment to a data-driven culture, the challenges they faced, and the strategies they employed to ensure every student thrives. Listen to our conversation below to glean insights from Kristin's experiences and the transformative initiatives at Norwalk Public Schools.
Three Key Takeaways from our Conversation with Kristin Schmitz:
- A Unified Approach to Data
It’s of the utmost importance that districts have a standardized system for collecting and analyzing data. Even before introducing new tools, educators at Norwalk Public Schools were trying to use data to inform instruction. However, this approach was not only cumbersome but also lacked a standardized method. By centralizing data sources, including state tests, NWEA, DIBELS, attendance, and grades, the district could make more informed decisions, ensuring that instructional strategies were tailored to student needs.
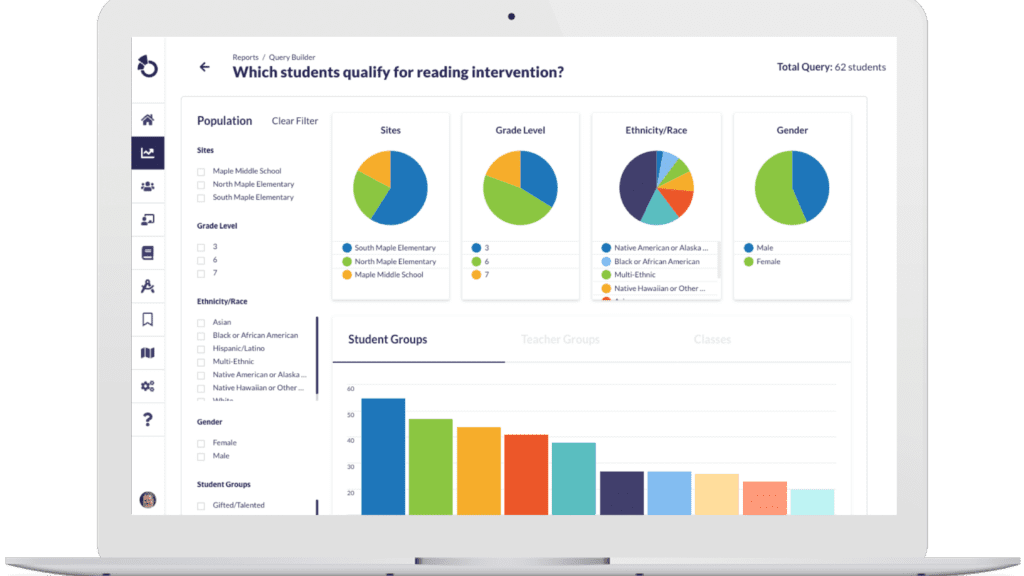
 Otus brings all of Norwalk Public School’s student data into a single location. This allows for a seamless evaluation of student performance so educational teams can make ongoing data-driven decisions.
- Holistic Understanding of Student Needs
Beyond academic metrics, non-academic data is just as significant in understanding and addressing student needs. For Norwalk Public Schools, tools such as the Panorama Student Survey and the Devereux Student Strengths Assessment (DESSA) were instrumental in gathering holistic data on students. This comprehensive approach ensures that educators have a 360-degree view of each student, encompassing social-emotional indicators, attendance, and academic performance, and ultimately allowing for more personalized support.
- Fostering a Data-Driven Culture
If a district wants to see real change, it’s key that their community has regular, structured discussions around data. At Norwalk Public Schools, educators know the importance of having protocols in place to guide these conversations, ensuring that data is not just collected but actively used to inform decision-making. By making data more accessible and interpretable, the district aims to create an environment where every decision is backed by insights, ensuring that every child receives the support they need.
Interview Transcript
Kendell Hunter (00:00:09)
All right, Kristen, would you mind just starting us off with a brief introduction of your name, your role, and more about the school district that you support?
Kristin Schmitz (00:00:18)
Absolutely so hi, I'm Kristen Schmidt, and I work for Norwalk Public Schools, where I am the Director of School Improvement at Norwalk. That's Norwalk, Connecticut. I know that there are some other Norwalks around the country. We are, I guess, a mid-sized school district. We've got about 11,000 students. And in my role, it's really about helping schools use data. So in the last year and a half since I joined the district, it's been about implementing systems so that we've got usable data and then helping schools to use that data
Kendell (00:00:52)
Well, thank you for sharing more about your district. It definitely sounds like you have a large population of students that you all support there and really some diverse needs. I'd love to hear more about Norwalk's Otus journey. I know we're sitting here chatting a little bit about Otus, but can you share more about what needs were present in your school community at Norwalk that prompted the district to explore and really adopt an all-in-one solution like Otus?
Kristin Schmitz (00:01:18)
Absolutely. So one of the things that Norwalk has been really strategic about and working on is shifting the culture to be much more data-driven. And the work has been around kind of standardizing the language around how we approach continuous improvement. We use the PDSA cycle, so Plan, Do, Study Act, which comes from the healthcare field. And we really realized that as we were asking schools to do this work, we hadn't provided a tool for them to be able to more effectively engage in the work. And so
While there was an expectation that schools were analyzing data and teachers were adjusting instruction based on that data, it was very cumbersome. Some schools had created various spreadsheets, some were doing things by hand. Nothing was standardized. It wasn't possible for school leaders to have access to classroom-level data or for district leaders to have access to school-level data. So we were looking for a solution that provided that visibility and also really made the analysis much easier for our educators. Our educators had to go to a lot of different places to get what's house in Otus now.
And so implementing Otus has also allowed our teachers access to everything from data around our multilingual learners to how they're performing on state tests, to how we use NWEA and Dibbles. So all of that being available in one place alongside attendance and grades, has been a huge leap forward in terms of our journey over the last year. I guess since we implemented Otus.
 Otus Regional Workshops offer users an excellent opportunity to dive deeply into Otus and expand their platform knowledge.
Kendell Hunter (00:03:11)
That's very helpful context. That all-in-one data piece is really just so critical. Teachers have limited time, and going across multiple systems is just not effective. So it's good to hear that you're all able to leverage technology to kind of help streamline how you can access that data. I know that I've heard you say about a year ago you all adopted Otus. I'm just wondering, especially given how large your district is, how many educators, administrators you all have, was there a particular implementation strategy that you had for bringing Otus to the community? I know many administrators are evaluating technology and kind of thinking about what is that strategic rollout, and I was kind of curious what your input would be on that or how you approached rolling out a new tool like Otus to the community.
Kristin Schmitz (00:03:57)
Sure. So we initially thought that we were going to kind of go with a train-the-trainer model, that we would use our instructional coaches to leverage this work. And so they were the first group that was actually trained, as well as our principals and assistant principals. It quickly became apparent, however, that we needed to do kind of more than that. There were some schools in which instructional coaches just took off and ran with it, and they were our early adopters of Otus. And then we had other places where that just wasn't happening for whatever the reason was. And so that shifted to becoming while initially, it was kind of like we gave our teachers the chance to opt in a little bit for that first semester, by the second semester, we took a much more strategic approach of a different grade to focus on every month. And then that grade level, those teacher teams received additional training and support in using Otus. So I did a lot of visiting with teacher teams, making sure, depending on where teachers were, that they were able to anything from access the platform or kind of do the more in-depth data analysis depending on how far along they were in their journey.
So I think that we dabbled a little bit in the first semester, but we got a lot more traction in the second semester, where there were much clearer expectations around usage.
Kendell Hunter (00:05:24)
That's great advice. I think that slow and intentional implementation certainly goes a long way from when you all started and kind of that vision for that all-in-one data dashboard where teachers and administrators can access everything in one place to where you all are at. Now, how has your use of Otus evolved? Have you dabbled in other areas of the platform? Is anyone giving assessments or is it strictly still just for that one data hub?
Kristin Schmitz (00:05:52)
No. So we are giving assessments across the district. We have common formative assessments in both English and mathematics. And so for grades two and up, we haven't done it as much with our early, early education, kindergarten, and first grade, but for grades two and up, those common formative assessments that come out of our district unit plans for both English and math are being administered in Otus and that's district-wide. We also do have some schools that are using Otus in KN, although it's not a district requirement. And then we have, in addition,
Some schools that have their own common formative assessments across the subject areas that they have created in the platform and are administering two, three, four times a year, depending on school practice. So we started with the more standardized assessments that are district-wide. And now, I think in our second year, we'll start to see a lot more implementation of school-level usage as well.
Kendell Hunter (00:06:55)
That's great to hear that you have kind of those multiple measures of data because as you mentioned, you are giving NWEA, you have a lot of different data sets, but that local temperature check of that formative progress. Have you heard any feedback from teachers around how that data is used to guide instruction or anything further around?
Kristin Schmitz (00:07:17)
Sure, yes. In addition to providing a data tool, we also provide a variety of protocols. So we have an item analysis protocol, know, pretty standard item analysis protocol that a lot of our teacher teams use and they will analyze the data in Otus together and then come up with the instructional next steps. Whether that's whole classroom reteach, small group or centers instruction or even individualized student support. We could definitely see,
I can hear in the conversation as I talk to teachers the difference in teachers who have used Otus for a little while. Once they get over that initial hurdle of learning a new platform, are seeing a lot of value in the kind of data that they're getting and how quickly they're getting that data.
Particularly with all of the new enhancements that have gone into the analytics in Otus and being able to see standards on the same page as question-level analysis and student-level data alongside student subgroup data. So they're actually seeing, we're hearing a lot of positive feedback from our teachers. There's always a little bit of a learning curve in terms of learning a new platform, teaching students to learn a new platform. But now that we're getting there, the response has been really positive.
 Otus users not only learn from the Otus team at regional workshops but also network with and glean knowledge from other educators utilizing the platform in neighboring districts.
Kendell Hunter (00:08:43)
We're really excited about some of those enhancements as well. The standards in the same place as your assessment data was a really exciting summer improvement. So I'm glad that I think I heard you say you all are moving forward with more of a standards-based grading approach as well. Did you mention that earlier?
Kristin Schmitz (00:10:20)
So we are really focused on standards this year and ensuring that all students are receiving grade level instruction that is engaging and that they can access that grade level standards. And so we're not necessarily changing our approach to grading in terms of how grades will be awarded, but we are really focused this year as a school district on making sure that all of our instruction is standards-aligned.
Kendell Hunter (00:9:32)
Is it safe to say that some of that will be done in Otus through those assessments. Are you all aligning your assessments, too?
Kristin Schmitz (00:14:04)
A lot of our math assessments were already really well aligned. Over the summer, the curriculum team has made adjustments to the English assessments to ensure that they are more standards-aligned and in fact, relied heavily on the Otus item bank in designing those assessments and really found that it was a great tool to be able to pull questions knowing by standard to be able to identify the best questions to use. And so we're excited to try out those assessments this year. Last year, they were more, I'd say, either teacher-created or pulled from some of our resources, and there was some feedback that maybe they weren't 100% standards-aligned. So those adjustments have been made with the help of the Otus Item bank, which was great.
Kendell Hunter (00:10:26)
Love to hear that. I'm glad that Otus has proven to be a partner as you all grow and implement those various initiatives to really ensure that students are getting the most out of their instruction and meeting those standards. So knowing how many ed tech tools school districts really across the country employ, I'm curious if at Norwalk, the team evaluates tools on a yearly basis, and if so, if there was any evaluation of Otus at the end of last year to just determine the impact, the future plans, and kind of what that long term usage looks like. Is that something that you all engage in?
Kristin Schmitz (00:11:06)
We don't really, not in a formalized way. I mean, we had pulled usage data and could see it growing kind of by leaps and bounds between the first sort of quarter of the year to the second quarter of the year and then third and fourth quarter of the year. So this year we're focused on standardizing the way that we are assessing our students so that there's less variability in our data, so that we're sure that our multilingual learners are receiving the supports they need while they take assessments, as well as our students with IEPs. So that the data that we get feels a lot more sort of credible and usable.
Kendell Hunter (00:11:48)
That makes perfect sense. I did take a sneak peek at your Otus account before we chatted, which I hope is okay. I wanted more about the different types of data that you all use, and I noticed that you all have that academic data that we touched on, like NWEA Map, but I also noticed you had some nonacademic data that you were looking at, including attendance and other factors. So I was wondering if you could share more, really, about how you're using a variety of types of data, including academic and nonacademic, to really meet the needs of all students. I know, I heard, you know, that you have a multilingual population. So I was curious how educators and administrators in Norwalk are really using data to ensure that equitable education for all.
Kristin Schmitz (00:12:30)
Yeah. So I think that in addition to the academic data, right. There's so much about students that is important to know. And when we look at why some students are being successful and why other students perhaps are not, there's more that we need to know about those students other than just how they performed on a particular assessment. So we have some social-emotional indicators that we house in ODA. So we give the Panorama survey, which does give some social-emotional data. We also give the DESA. And so
Whether it’s a special education teacher going into a meeting in order to write an IEP or a classroom teacher wanting to understand a little bit more of the history of what’s happening with a student, they’re able to access social-emotional and attendance data alongside academic data, all in Otus.
We also went back and loaded as far back as 2015 and 16. Clearly a child in the primary grades. You're not going to have huge number of years worth of data. But as students get into the secondary, middle and high school years, sometimes having that perspective of knowing that a student has encountered maybe a sudden change in something like attendance or that this has been a pattern over time can be helpful in figuring out how best to support that student.
Kendell Hunter (00:14:02)
Absolutely. And I think it's great that you have that total picture that really that whole child look. Many schools are looking to have that kind of SEL indicator, but don't yet have that standard data set that they can use to say, here's the academic picture, here's what's happening in the class, and then here's where they are on that particular measure. So I was very impressed by how much of the variety of data that you have on students to really be able to inform.
Kristin Schmitz (00:14:28)
Yeah. And we really do want it to be the place that educators need to go. So if that data doesn't live in Otus, then they're still going to need to head to other platforms to get that data. So we really feel strongly that we need to house it all in one place.
Kendell Hunter (00:14:47)
Absolutely. In thinking about all of that data, one of the things that our trainers at Otus often do is encourage administrators to approach Otus through, like, a question-and-answer mindset. What questions do you have about your data and then use that to drive your analysis? Because if you're just kind of poking around, you may not get the same insights as to if you have a certain question you're looking to answer. Have you all approached data in that way at all, or are there any questions that you've been able to answer in Otus? A common one that we've heard administrators say is, I want to know which ell students are performing below or above a benchmark on a particular assessment. Is that something that resonates at all.
Kristin Schmitz (00:15:30)
So I think one of the things we're really still building is the use of Otus as an analytic tool to answer those questions. All of our schools develop school improvement plans, and so within that school improvement plan, they set a goal around rigorous instruction in English as well as in math. They also set an equity goal, they set a goal around supportive environment. And so all of those goals can be progress monitored, right? That might be a question to ask is how am I doing in relation to that goal? And
I know that the analytics in Otus allows those questions to be asked and answered, and I tend to go there to do so, but we are definitely still building capacity so that it doesn't become looking at spreadsheets or pulling out spreadsheets. It's so much quicker, it's so much more available within the analytics section of Otus.
I think that one of the questions that does get asked is which are my students that fall below a particular benchmark that are going to be eligible for kind of improvement services? So to be into the SRBI process? So that is one question that I know we do and can answer very quickly within the Otus data sets.
Kendell Hunter (00:16:59)
That's a great example of a use case there that many other administrators have that same question which students do we need to better support if they're not already receiving services through a different provider, whether they have an IEP or if they have a case manager or what's next for those students to close those gaps? So, definitely sounds like you all are doing great work to support every child in your school district, which is very impressive. Kristen having really worked with administrators across the country, I often find that a shift is needed when thinking about education technology, and many districts often take the tool and say that's the goal for the year. But in the best-case scenario, the tool isn't the goal, right? The goal is your students, their growth, your initiatives, how the tool supports that. Do you feel like Otus does support the goals that you all have for students and your district? And if so, just elaborate more on how.
Kristin Schmitz (00:17:54)
Sure, so I absolutely do think so. Ultimately, our district is focused on creating more equitable outcomes, ensuring that all of our students graduate future-ready. However, that is defined, and however, that student doesn't necessarily mean college-ready. It could be workforce-ready, it could be trade ready, could be military-ready, right? Whatever it is that the student chooses their path. And in order to get students there, we need to know where students are in relation to those goals and then design next steps and assess the effectiveness of those next steps. So we absolutely think that
Otus is a pivotal tool in being able to answer questions around which students are learning which are not. Where do they need additional support? And then ultimately, when that support is given to assess the effectiveness of that support, we can't achieve equitable outcomes if we can't design instructional experiences or give students what they need based on what they need. And so Otus helps us identify both what they need and whether or not we're providing support in the right places.
Kendell Hunter (00:19:14)
Absolutely. Thank you for sharing that. I just have one or two more questions here for you. I'm curious, what advice would you give to another school administrator who's really looking to improve ways that staff use data? I know you mentioned this is something you all are working for, but for somebody who's a little bit further behind in the process and just looking to get started, any advice?
Kristin Schmitz (00:19:36)
So I would say starting with a protocol, providing a protocol and being intentional around its usage, I think is critical. Something simple like an item analysis protocol really lends itself well to the data that we get in Otus. I think making sure that team meetings always have a data component, whether that is the entirety of the team meeting or some portion of the team meeting, if there are other items that need to be on the agenda. And I think that that needs to occur, whether you're talking about teacher team meetings, instructional leadership team meetings, leadership team meetings, district team meetings, that really putting data on the agenda each and every time and not having conversations around generalities. It's a critical part of, kind of, being data-driven or data-focused. And then again, to have a protocol to structure that conversation, it's very easy to kind of meander around data and have it not be a focused conversation. So really structuring that conversation and deciding on next steps each and every time are critical, I guess pieces of advice I would offer.
Kendell Hunter (00:20:58)
I think that's excellent advice. One final question for you here. If an administrator really anywhere in the Northeast or across the country was looking to improve a school's data culture through Otus, any advice for them?
Kristin Schmitz (00:21:13)
Yeah, I mean, I think it can easily be done through Otus, right? So I think
The beauty of the Otus platform is it makes the data so consumable.
And that's sometimes where folks who are maybe a little less comfortable with data can get hung up in looking at displays and what does it mean and how can I drill down to get more information or how can I quickly sort or filter? And so using the Otus platform takes away the need for some of those technological skills to be able to manipulate the data and work with the data. And so I think keeping kind of those same things I shared in the last question around, keeping a focus on data and having a protocol for its usage work really nicely with the Otus platform. And I think there are going to be bumps along the road as there is with any new platform being adopted, things are never going to go 100% as smoothly as you might wish. And it has nothing to do with the platform. It's just the nature of learning to use a new tool. But I think that we're seeing a huge benefit.
Kendell Hunter (00:22:28)
I love the word consumable. That was a great way to describe it. It really is so important that the data was digestible and makes sense, because, like you said, not everybody approaches those conversations with that same data, same as our students. Right. We all come to the table with a different level of data comfort, and having those really digestible consumable visuals can help to make sense of something that might be a little bit more intimidating or out of someone's comfort zone. So that's great advice. Well, thank you so much, Kristen, for chatting and sharing more about your Otus journey. Some of the things that you all are doing within your district to ensure equity. I think you've really made some great points for other administrators to consider and really employ as they head into the new school year here. So we appreciate you and your partnership.
Kristin Schmitz (00:23:14)
Well, thank you, Kendell. It's been a pleasure to have this conversation with you, and it's been a pleasure to work with Otus over the last year, and I look forward to our continued work together.
Kendell Hunter (00:23:24)
Thank you.
Request a demo!
See exactly how Otus can help your school accelerate student growth and improve student outcomes – all while saving educators time.