Apr 16, 2026
Every Spring, K-12 leaders are faced with the important task of showcasing academic performance from the beginning of the year to the end. This period of reflection and reporting is crucial, especially as school boards seek visual and digestible presentations to understand student progress as the academic year winds down.
However, presenting complex student data in a way that is both clear and impactful can be truly challenging. Let’s dive into four tips to enhance the clarity and impact of your presentations. Following these, we'll touch on how the right data solutions can further support these efforts.
1. Understand Your Audience
The first step in making data meaningful is to understand who your audience is. School board members come from diverse backgrounds and possess varying levels of expertise in data analysis. Tailoring your presentation to meet their understanding is key. This means avoiding educational jargon and focusing on what matters most: student outcomes. By aligning your data presentation with the board's priorities—whether it's improving literacy rates, decreasing absenteeism, or enhancing college readiness—you can ensure your message is both relevant and impactful.
For instance, consider a school board with several members who have a background in business rather than education. When presenting data on literacy rates, you might choose to frame the discussion around return on investment (ROI) for literacy programs, comparing the cost of interventions with the long-term benefits on student performance. This approach translates educational outcomes into a language they understand, making the data more relatable and compelling.
2. Simplify Complex Data
The heart of effective data communication lies in simplification. Complex data sets can be overwhelming, so it's essential to break them down into visualizations, charts, and graphs that are easy to understand at a glance. For instance, instead of presenting raw test scores, consider using color-coded progress charts or graphs that show trends over time. This not only makes the data more accessible but also helps highlight the progress and areas needing attention without the need for extensive explanation.
Imagine you're dealing with a complex dataset on student engagement levels across different subjects. By creating a simple bar graph that highlights engagement scores by subject, you can easily pinpoint areas of strength and concern. This visual helps the board quickly grasp which subjects might need more resources or different teaching strategies, facilitating a focused discussion on improving student engagement.
3. Highlight Key Insights
Amidst the sea of data, it's crucial to focus on key insights that drive actionable recommendations. This involves not just presenting data, but also interpreting it to show what it means for the school or district. Highlighting issues such as a gap in reading proficiency among certain grades and suggesting targeted interventions makes it easier for the school board to grasp the implications of the data and how they can support initiatives to address these challenges.
For example, after presenting a graph showing a noticeable drop in math proficiency in the 8th grade, you could follow up with an analysis correlating this drop with a lack of resources or changes in curriculum. This insight would direct the conversation toward actionable solutions, such as reallocating resources or revising the curriculum, making it clear how the board can help address the issue.
4. Prepare for Questions
Anticipating and preparing for questions from the school board is a critical final step. This preparation shows your thorough understanding of the data and builds confidence in your recommendations. Practice explaining your data in simple terms and be ready to provide deeper dives into the data for those who may request it. Being transparent about data limitations and the steps being taken to address any issues will also help in maintaining trust and credibility.
Consider a scenario where you present data on the success of a new STEM initiative. Be prepared to answer questions about the initiative's impact on student outcomes, how it compares to previous programs, and its cost-effectiveness. Having detailed responses ready, such as specific improvements in STEM-related test scores or increased student interest in STEM fields, demonstrates your understanding of the data and reassures the board of the initiative's value.
Finding the Right Data Solution for Your School
Finding the right data solution is crucial for K-12 leaders who aim to present student data to their school boards more effectively. An ideal tool simplifies complex data, highlights key insights, and prepares administrators for potential questions, making the data not only accessible but actionable. It should enhance understanding and facilitate strategic decision-making, focusing on improving student outcomes.
Otus offers an integrated student data and assessment solution tailored to the needs of schools and districts, helping to transform the way data is utilized to inform educational strategies and decisions.
How Otus Supports Effective Data Presentation
Real-Time Insights: Otus provides immediate access to performance and usage data, simplifying the task of showcasing current trends and outcomes in student achievement. This feature ensures that school boards receive the most up-to-date information, enabling timely and informed discussions.
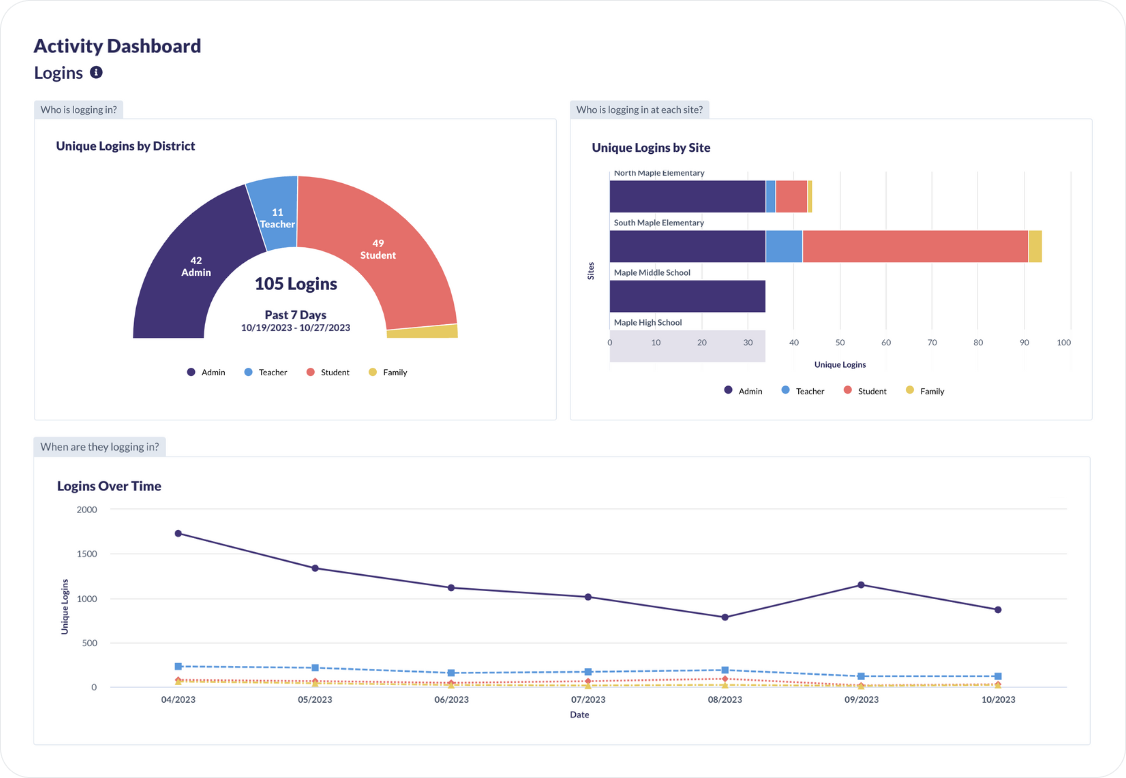
Real-time usage data can be used to illustrate how a tool is being utilized and the level of engagement among teachers, administrators, students and families.
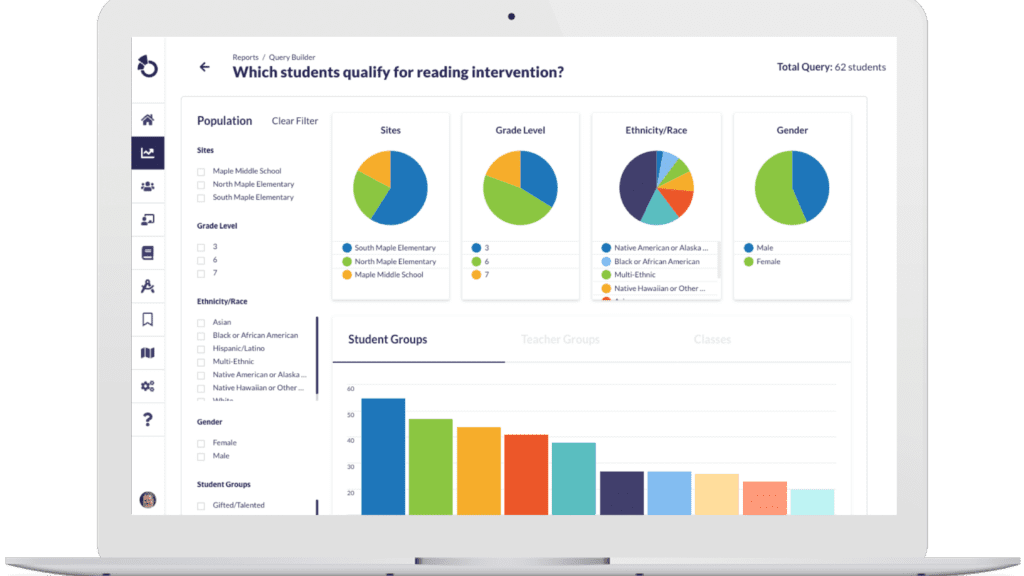
Comprehensive Data Analysis: Otus’ ability to analyze various assessments with intuitive data visualizations means administrators can easily convey complex student performance data in an understandable format. This aids in highlighting specific areas of achievement or concern without overwhelming board members with raw data.
Targeted Interventions: Otus' real-time data analysis helps identify students who are struggling and the areas where they need support. Presenting this information to the school board can streamline decisions on resource allocation and intervention strategies, ensuring that efforts are focused where they are most needed.
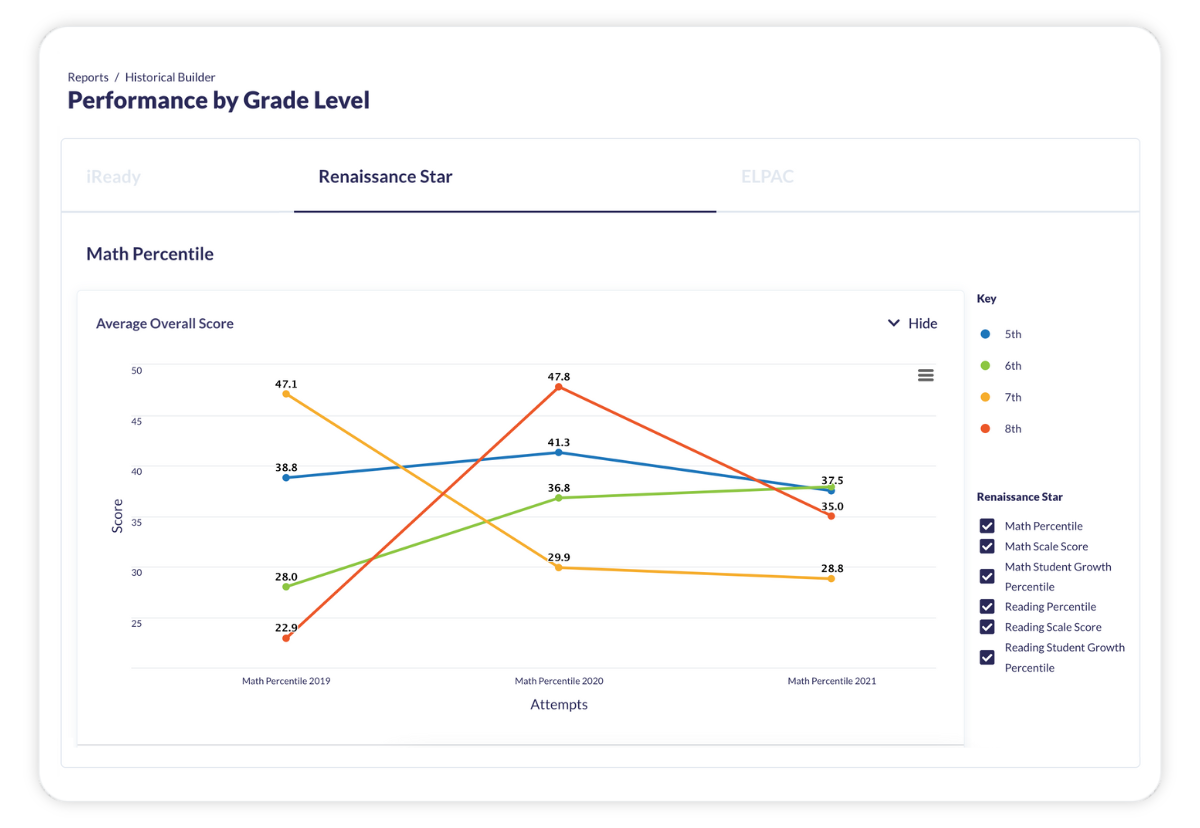
Custom Reporting: Otus allows users to create custom reports that track progress and compare outcomes over time across different demographics. This feature is invaluable for demonstrating the effectiveness of programs and initiatives to the school board and providing a clear picture of progress toward district goals.
Otus presents data from any assessment in an accessible and actionable manner.
Actionable Plans: With Otus, administrators can develop and monitor custom progress plans for students, making it easier to discuss how individual and group interventions are guiding students toward their goals. Sharing these plans and their outcomes with the school board reinforces the strategic use of data to drive educational success.
Using Otus, K-12 leaders can ensure their presentations to school boards are not just informative but also strategically aligned with the goals of improving student success and school performance. Otus streamlines the process of making data accessible and actionable, supporting a more effective dialogue between administrators and school boards. To learn more about Otus, get in touch with our team.
Related Resources
Request a demo!
See exactly how Otus can help your school accelerate student growth and improve student outcomes – all while saving educators time.