Making the most of NWEA MAP Growth data starts with understanding what the data is telling you at the district, school, class, and student level. This webinar, led by an NWEA expert, will guide you through understanding MAP Growth scores, identifying student strengths and needs, and using data to inform instruction.
Watch the webinar to learn how to utilize your data effectively, including:
- What MAP Growth scores mean
and how they can provide a clearer picture of a student’s instructional needs. - How to use the data
to identify each student’s relative strengths and areas needing improvement. - How MAP Growth data helps
identify where formative assessments are needed to support student growth. - Strategies
for implementing high-level interventions and tracking them using
Otus to ensure they are effective and continuously optimized.
Three Key Insights for School Leaders to Maximize MAP Growth Data
Use MAP Growth Data to Drive Smarter Instruction
When it comes to understanding student performance, MAP Growth data does more than just provide test scores—it gives educators the insights they need to make real, meaningful changes in the classroom. By analyzing this data at the class, school, and district levels, school leaders can see what’s working, identify areas that need improvement, and adjust instructional strategies to ensure every student makes progress.
For example, district administrators can dig into trends across multiple schools or grades to identify which ones are excelling and where more support may be needed. With MAP Growth data, it’s easier to understand the full picture and make informed decisions.
“Map Growth is great for showing trends across a school or district to determine if a new program or approach to teaching is positively impacting students. Administrators can also examine data across grades or schools to see if there’s a school or a grade that's really excelling or showing that they need support. This can be a really powerful tool to uncover what's driving high growth in any schools or grade levels.” — Mary Resanovich, NWEA
Tailor Support to Meet Students Where They Are
One of the most valuable features of MAP Growth is its ability to pinpoint where each student stands in their learning journey, whether they need extra support or are ready for more challenging material. By measuring both achievement and growth, MAP Growth allows teachers to understand the unique needs of each student and provide targeted interventions that make a difference.
This personalized approach ensures that no student slips through the cracks. Teachers can use MAP Growth data to adjust their instruction, offering additional scaffolding where necessary or creating enrichment opportunities for students who are ahead.
“Map Growth data can be used as one of multiple measures to determine students who might need extra support. Maybe they don't need kinds of intervention, but they might need that little bit of extra support or scaffolding, or who might be ready for enrichment or a little bit more challenge.“— Mary Resanovich, NWEA
Shift the Focus From Achievement to Growth
It’s easy to focus on test scores and proficiency, but MAP Growth highlights the importance of student growth over time. Students who may not yet be at grade level can still show incredible progress, and that progress deserves to be celebrated. MAP Growth helps educators focus on growth alongside achievement, allowing them to track how students move forward, no matter where they start.
This is especially important for students performing below grade level—teachers can use MAP Growth data to track their growth, intervene when necessary, and set realistic goals that push students toward long-term success. This shift in focus helps reframe conversations around student performance, moving from “where they are” to “how far they’ve come.”
“Often in education, we tend to orient more around the idea of achievement…but if we layer in growth, it shifts that perspective a bit. It changes the discussion. So if we look at how much growth a student made, we say, ‘Maybe they haven't achieved that same level as other students, but they've made much more significant growth.’” — Mary Resanovich, NWEA
Otus & MAP Growth: Providing Insights to Make Better Decisions
Districts and schools can review MAP Growth data directly in the Otus platform. This connection enables educators to view and analyze MAP Growth results alongside other data, including classroom assessments, attendance, and behavior, to gain a more comprehensive understanding of each student’s performance. Whether it’s identifying trends or providing targeted support, Otus equips school leaders with a complete picture of student performance and the necessary tools to support growth, including:

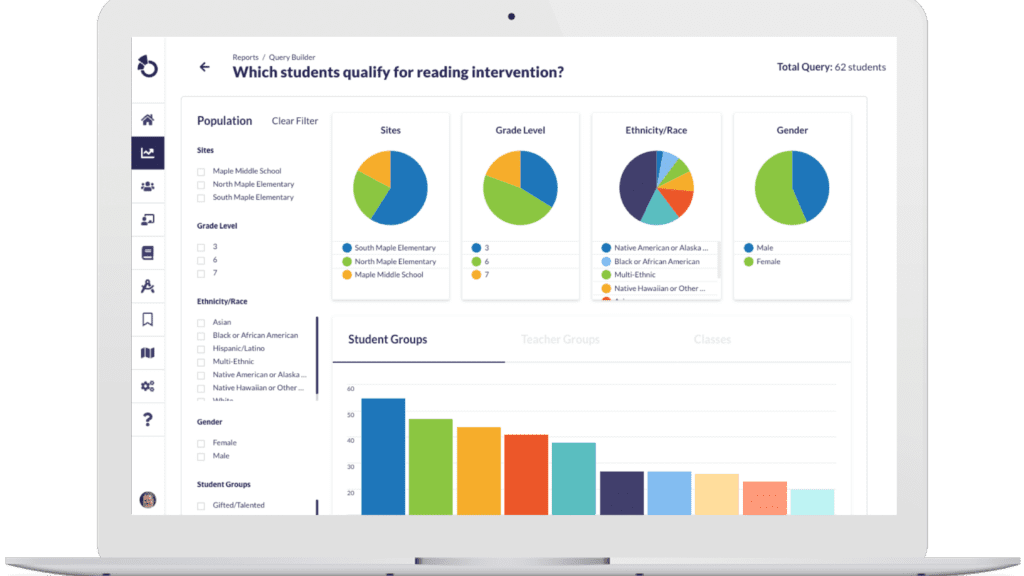
Data Visualization: Otus provides various visual tools, including graphs and charts, that show MAP Growth RIT scores, growth trends, and performance breakdowns by subject area, helping educators easily interpret the data.
Formative Assessment: MAP Growth can play a critical role in shaping formative assessment strategies throughout the school year. Teachers can deliver formative assessments in Otus and use the ongoing data to adjust their instructional approaches between MAP Growth testing periods.
Actionable Insights: Teachers and administrators can track student growth over time, compare MAP scores with other assessments, and create targeted instructional plans or intervention strategies based on the data.
Intervention and Instructional Planning: Based on MAP Growth results, educators can use Otus to track interventions or assign learning resources, aligning classroom instruction with each student's instructional level.
By providing these tools, Otus helps schools use MAP Growth data effectively to enhance personalized learning and data-driven decision-making.
Book a demo to see how Otus can help you maximize the potential of MAP Growth data and support personalized learning for all students.
Related Resources
Request a demo!
See exactly how Otus can help your school accelerate student growth and improve student outcomes – all while saving educators time.


